Let’s learn how to use Tidal Curves. Tide Tables will give you the Times and Heights of High and Low Water but often we need to find out the Times and Heights for somewhere between the two. For example you may be entering a river with a bar or wanting to use a drying berth in a small harbour. The explanation below should make things clear.
So, a Tidal Curve is used to answer two questions.
1. At what Time will the Height of Tide be at a certain level?
2. What will be the Height of Tide at a certain Time?
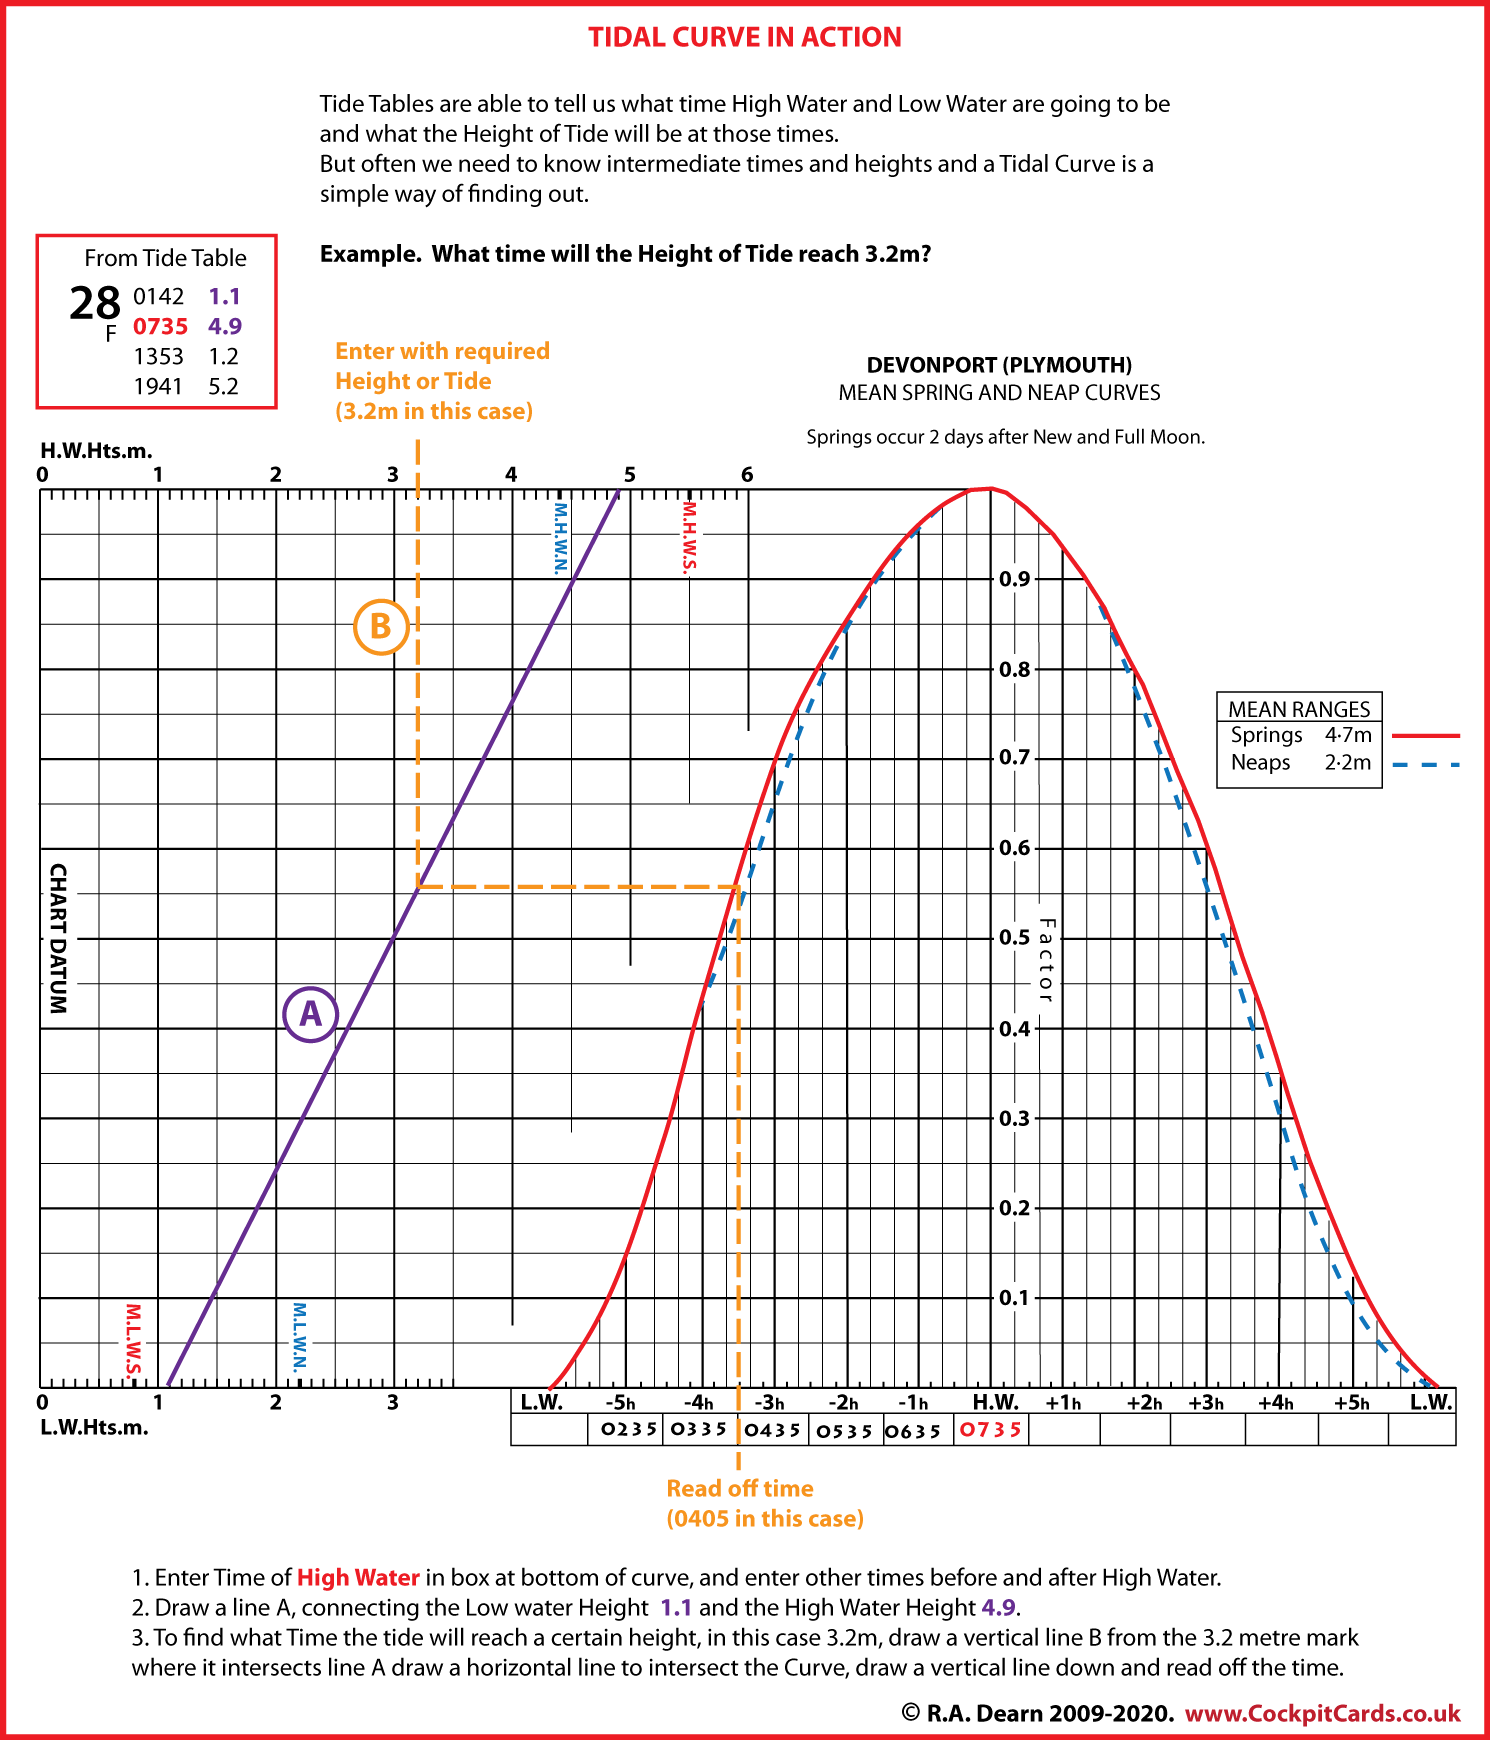
The use of the Tidal Curve is most easily explained with the help of the diagram below. This example answers the question ‘At what time will the Height of Tide reach 3.2 metres?’.
Tidal Curves in Action
The example above shows us starting with a required height and we want to find a time. We can just as easily enter with a time to find out a height. The Red curve shown above is for Spring Tides. Where it differs for Neap Tides a dashed line (seen above in blue) is also shown . Interpolation by eye is used where required.
Tidal Curves for Standard Ports are found in Admiralty Tide Tables and also in Nautical Almanacs such as Reeds. For Secondary Ports use the Curve for the relevant Standard Port. The almanac will make it clear which Standard Port you need to refer to. For example, the Standard Port for Looe in Cornwall is Devonport (Plymouth).